Independent concept / A small dataset, carefully explained
After-hours library
A fictional library-visits dataset used to compare a summary view with the numbers underneath.
The reading problem
Show a reader what is being compared before asking them to interpret the pattern.
A deliberate arrangement
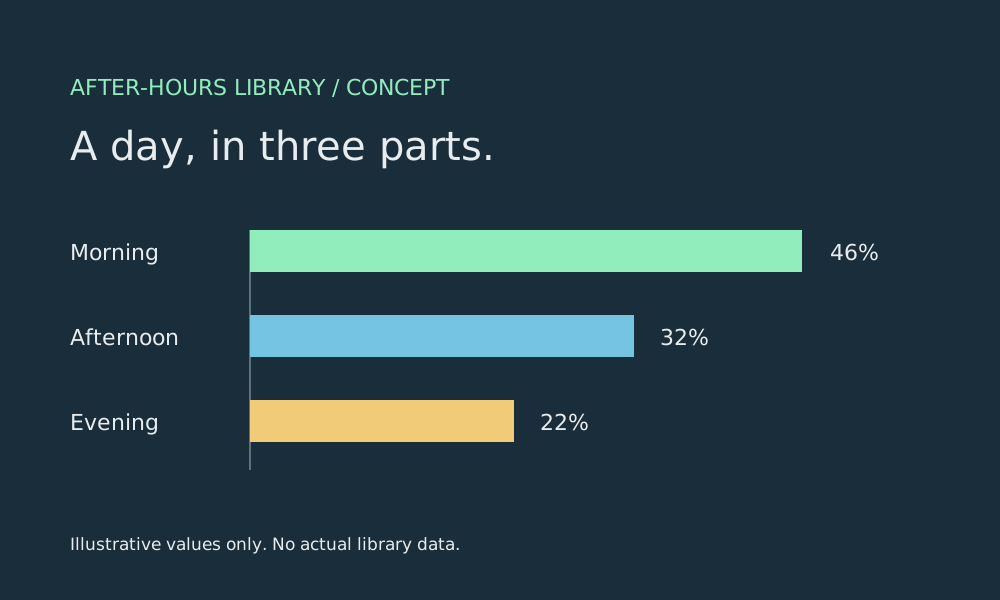
The diagram uses a common baseline and direct labels. Supporting notes state the unit and fictional status of the data; colour reinforces the categories without being the only way to identify them.
To commission a comparable piece, define the intended reader, approve the source information and identify the environment in which the visual will be used. The format and editing requirements follow that context.
A small demonstration
One dataset.
Two useful views.
Change the labels to compare a share of the total with the underlying illustrative values.
Illustrative shares: 46%, 32%, 22%. Fictional sample data, not a report of real visits.
Self-initiated fictional brief. No client commission, external validation or real-world research result is claimed.